

Update
Introducing: ETF breakdowns
We are excited to announce the launch of ETF Breakdowns in Fey, extending our commitment to providing meticulously designed tools that empower you to make more informed investment decisions. Just like our popular Stocks canvas, the new ETF canvas has been crafted with precision and usability in mind.
Key Features Include:
- Statistics and KPIs: Explore essential metrics such as AUM, holdings count, and inception date, along with performance indicators like 30-Day yield, dividend yield, and expense ratio. Delve into market trends with 52-week high/low data, assess valuation through PE ratio, and gauge trade volumes for comprehensive ETF analysis.
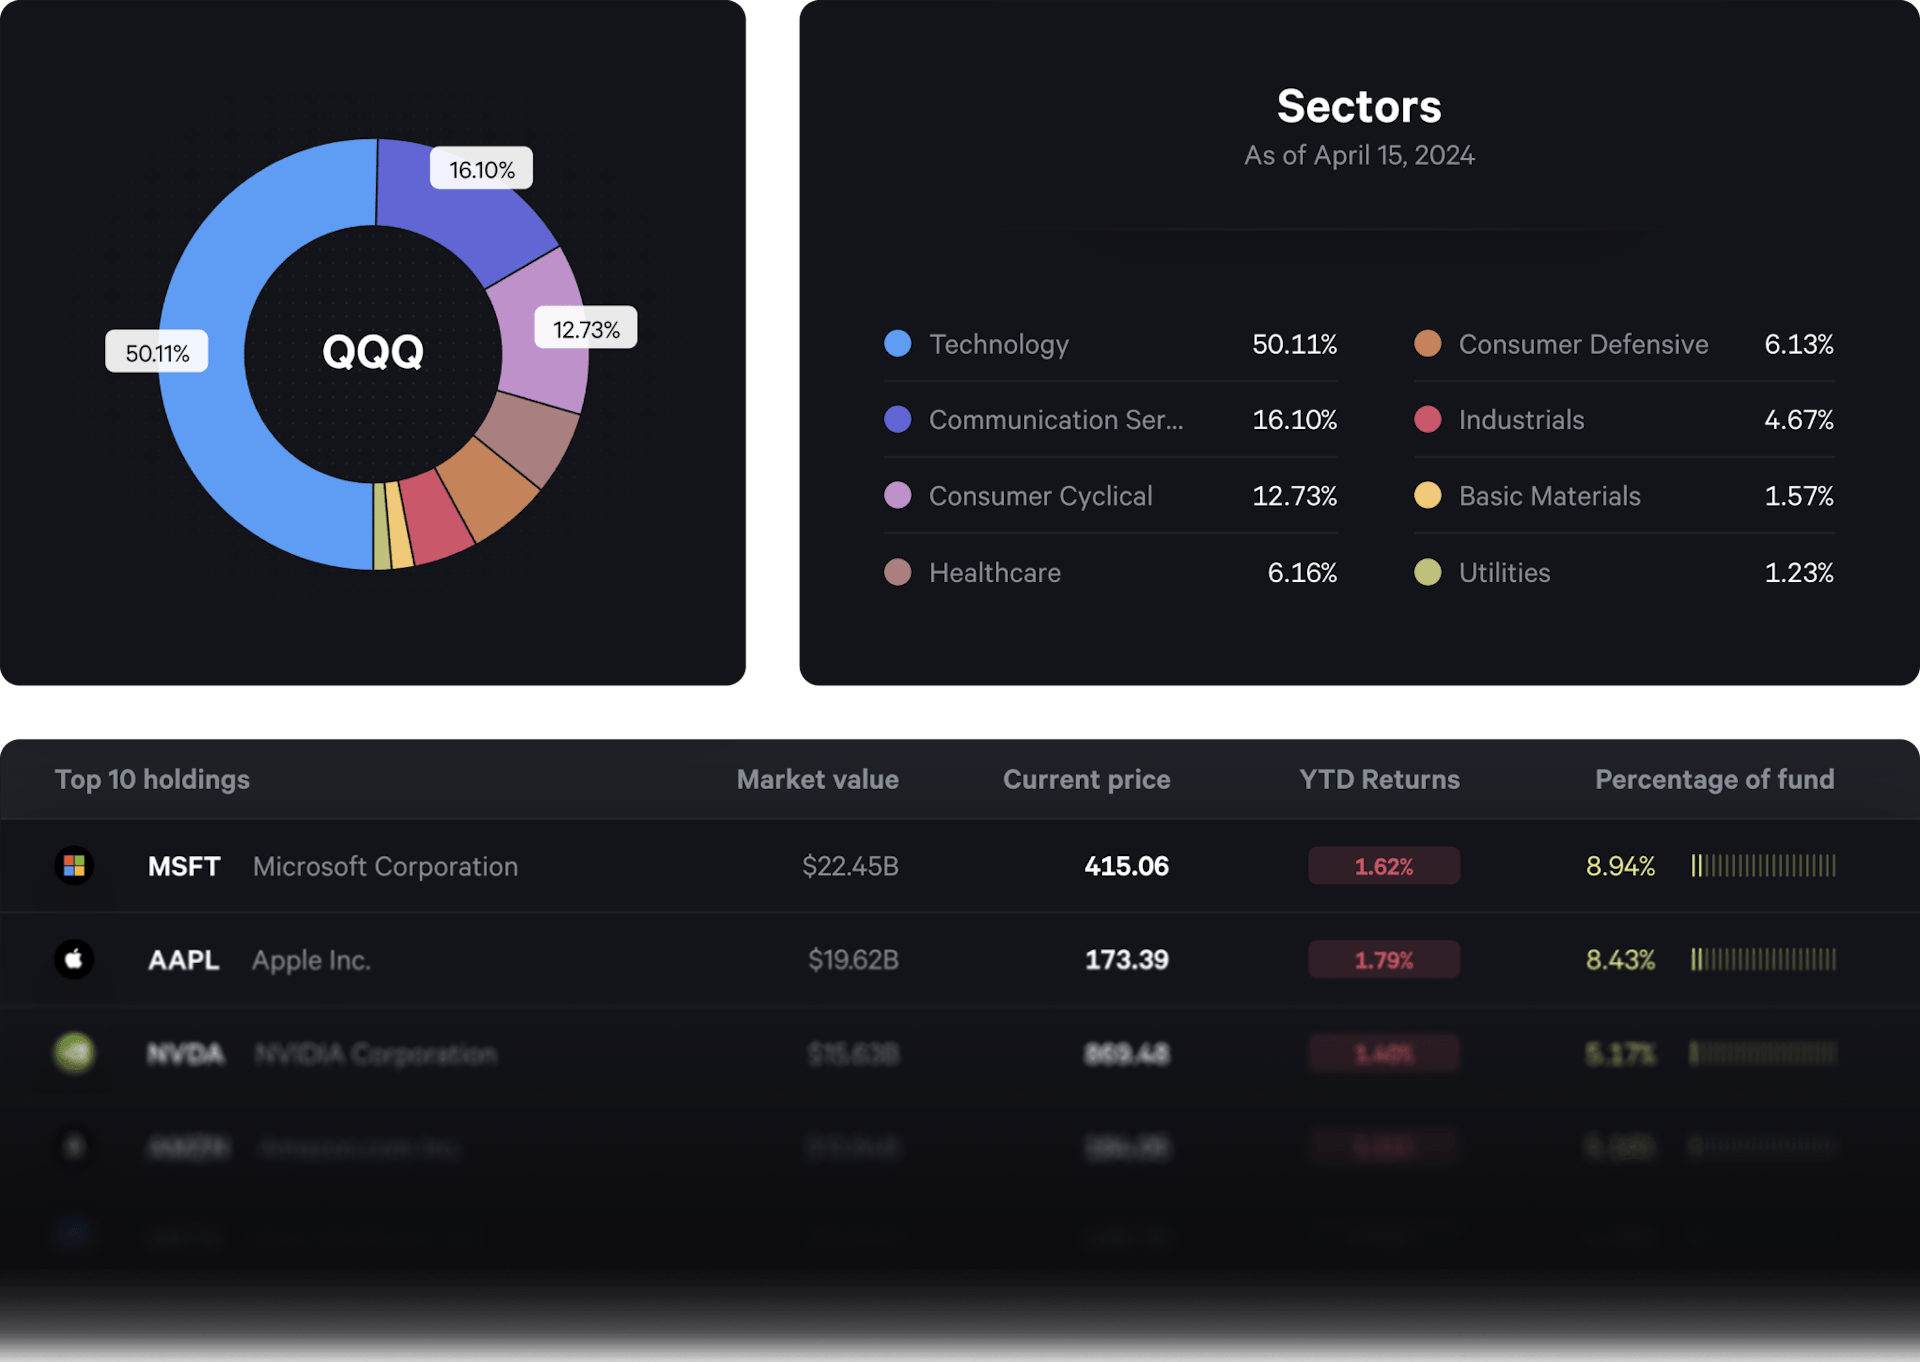
- Holdings summary: Dive deep into the assets under management within the ETF. Our comprehensive breakdown helps you see what’s inside at a glance.
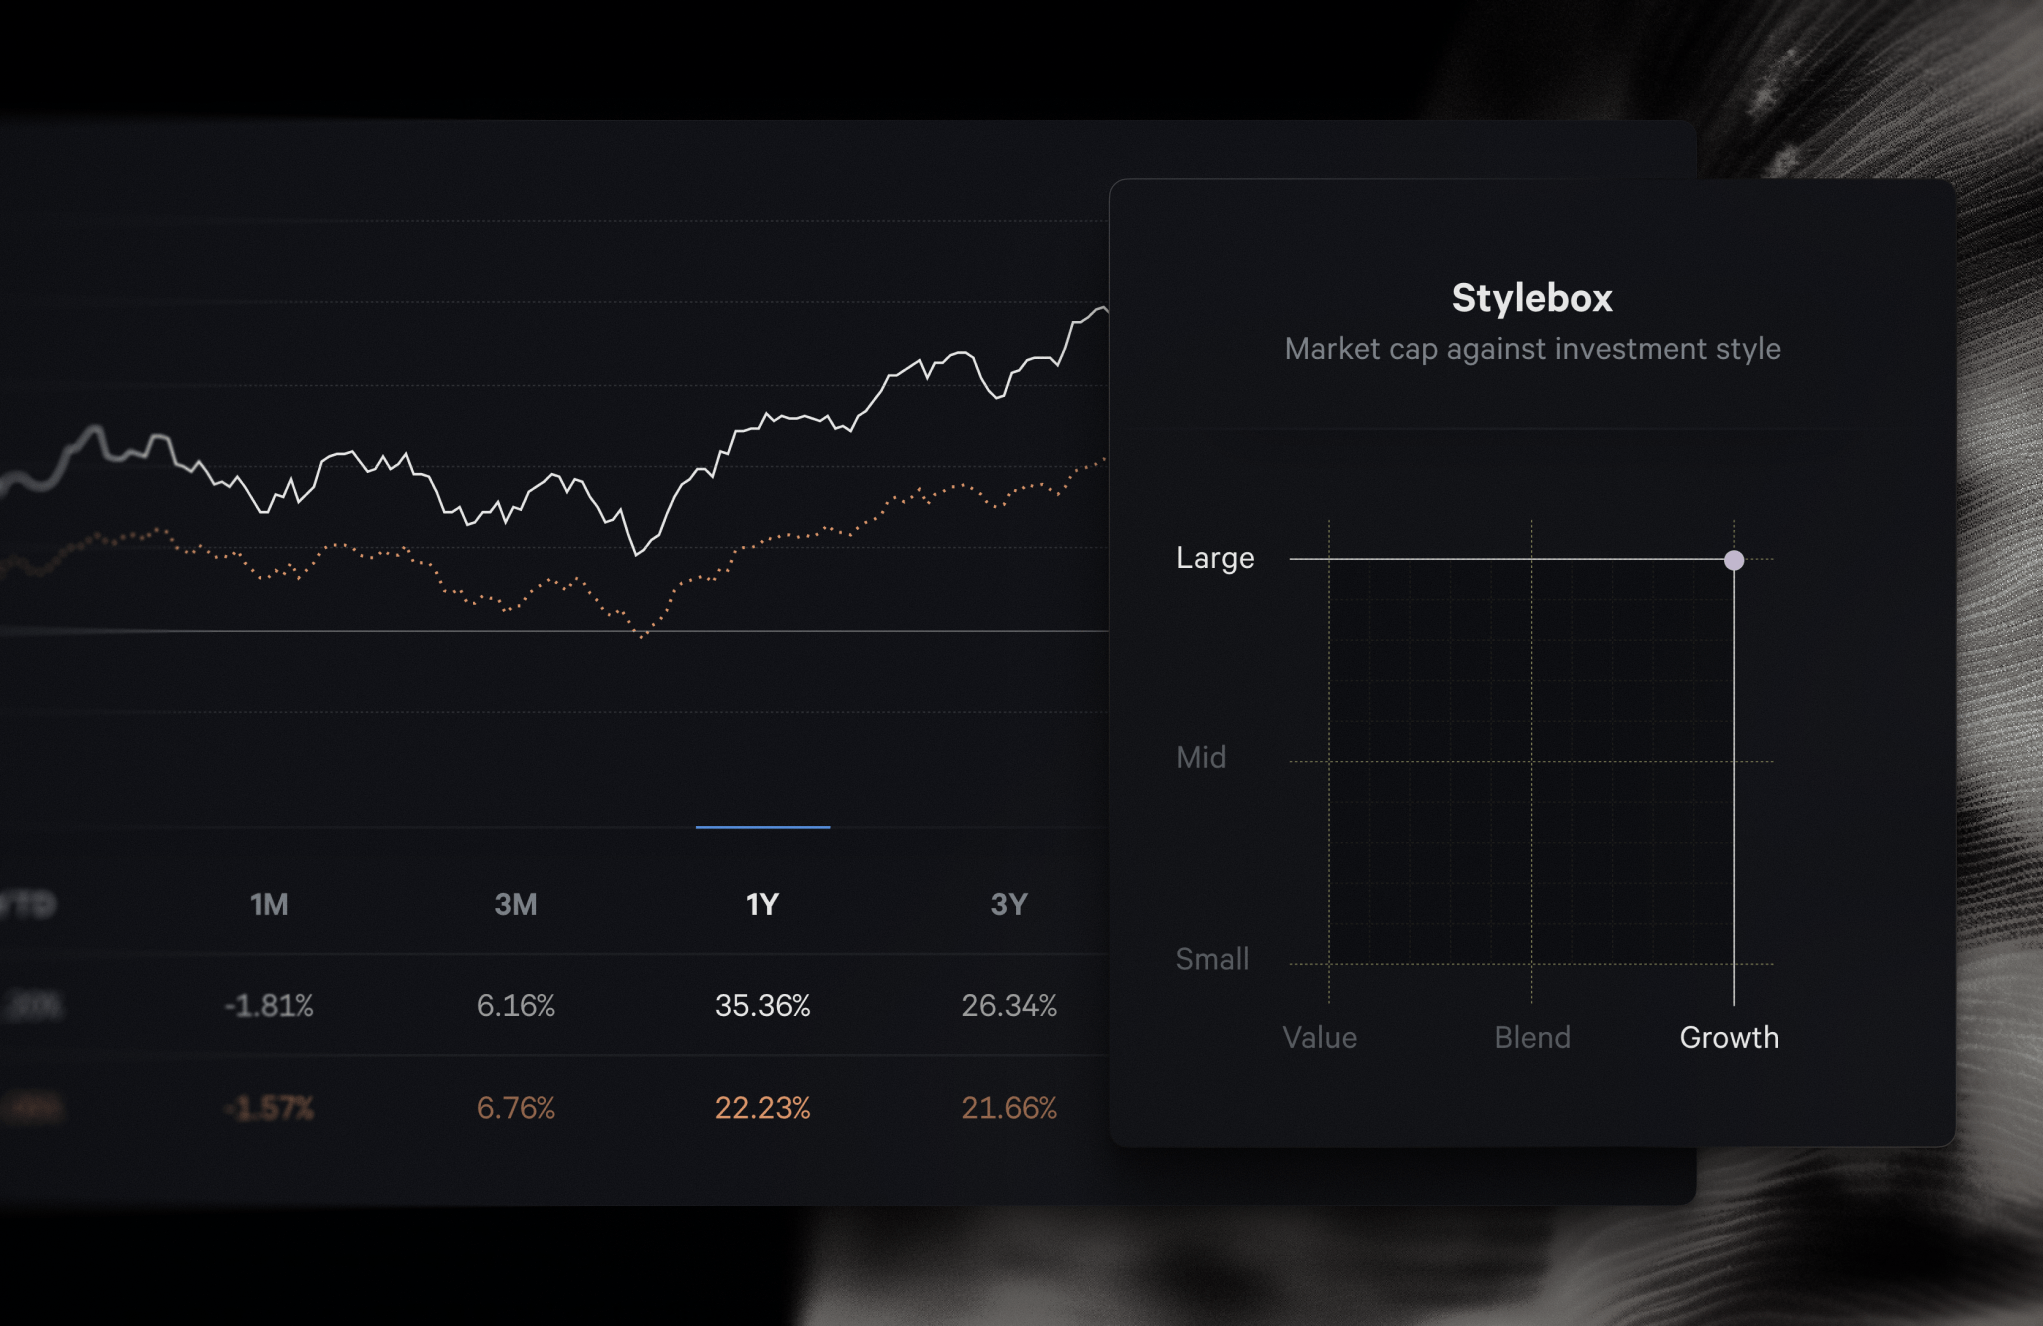
- Trailing returns with benchmark: Visualize performance over time against relevant benchmarks. This feature allows you to assess how the ETF stacks up in the broader market context.
- Fund characteristics: Assess asset distribution with our “Stylebox” showing market cap against investment style. Key fund characteristics are detailed alongside benchmarks, providing a snapshot of stock counts, cap medians, ratios, dividend yields, and net assets.
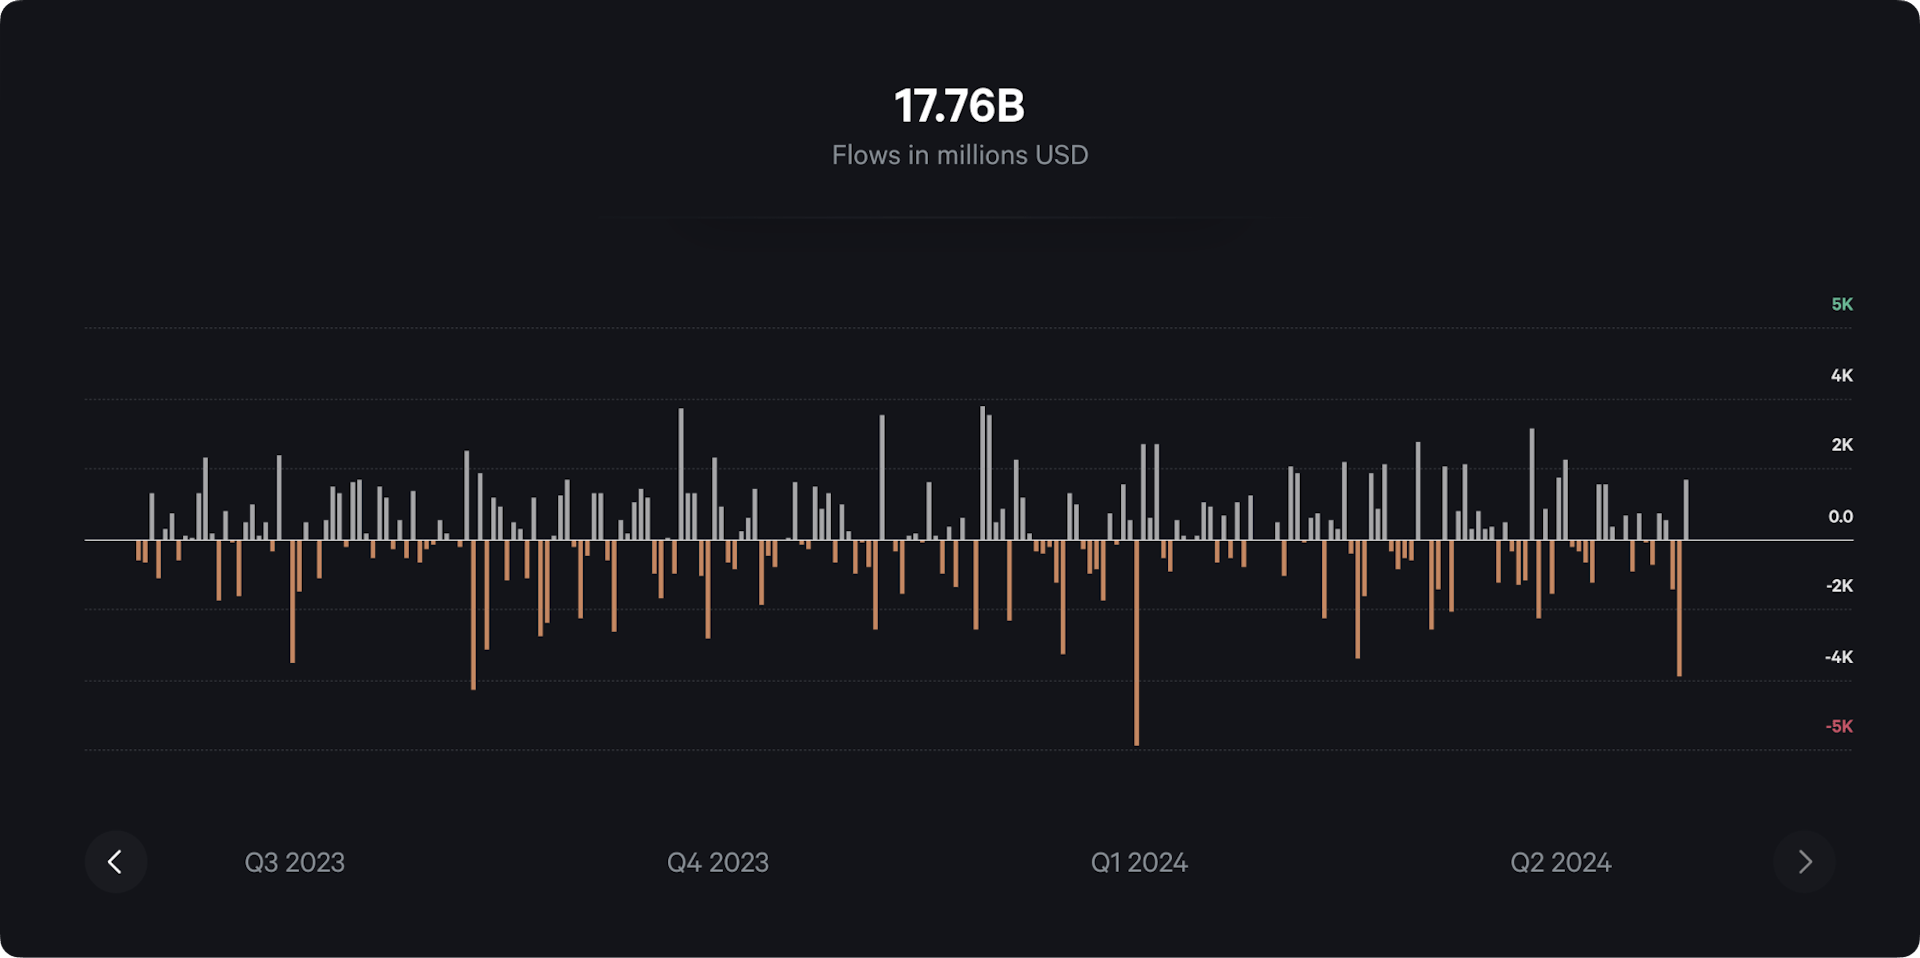
- Daily net flows chart: Track investment flows in and out of the ETF with our daily updated charts. This insight is vital for understanding market trends and investor behavior.
- Dividend breakdown: Explore the dividend distribution of the ETF. We provide detailed information on dividend yields and payout frequencies to help you evaluate potential returns.
We strongly believe in transparency and detailed analytics to support your investment decisions. The new ETF Canvas is just another step towards enhancing your ability to navigate the financial markets with confidence and insight.