

Improvement
Enhanced earnings insights.
We’ve recently made several updates to our Earnings feature to provide a more detailed and visually compelling analysis experience.
What changed
- Earnings history data sheet: Dive deep into a company's performance with our new data sheet, which offers a chronological record of earnings outcomes, estimated vs. actual EPS, and revenue figures.
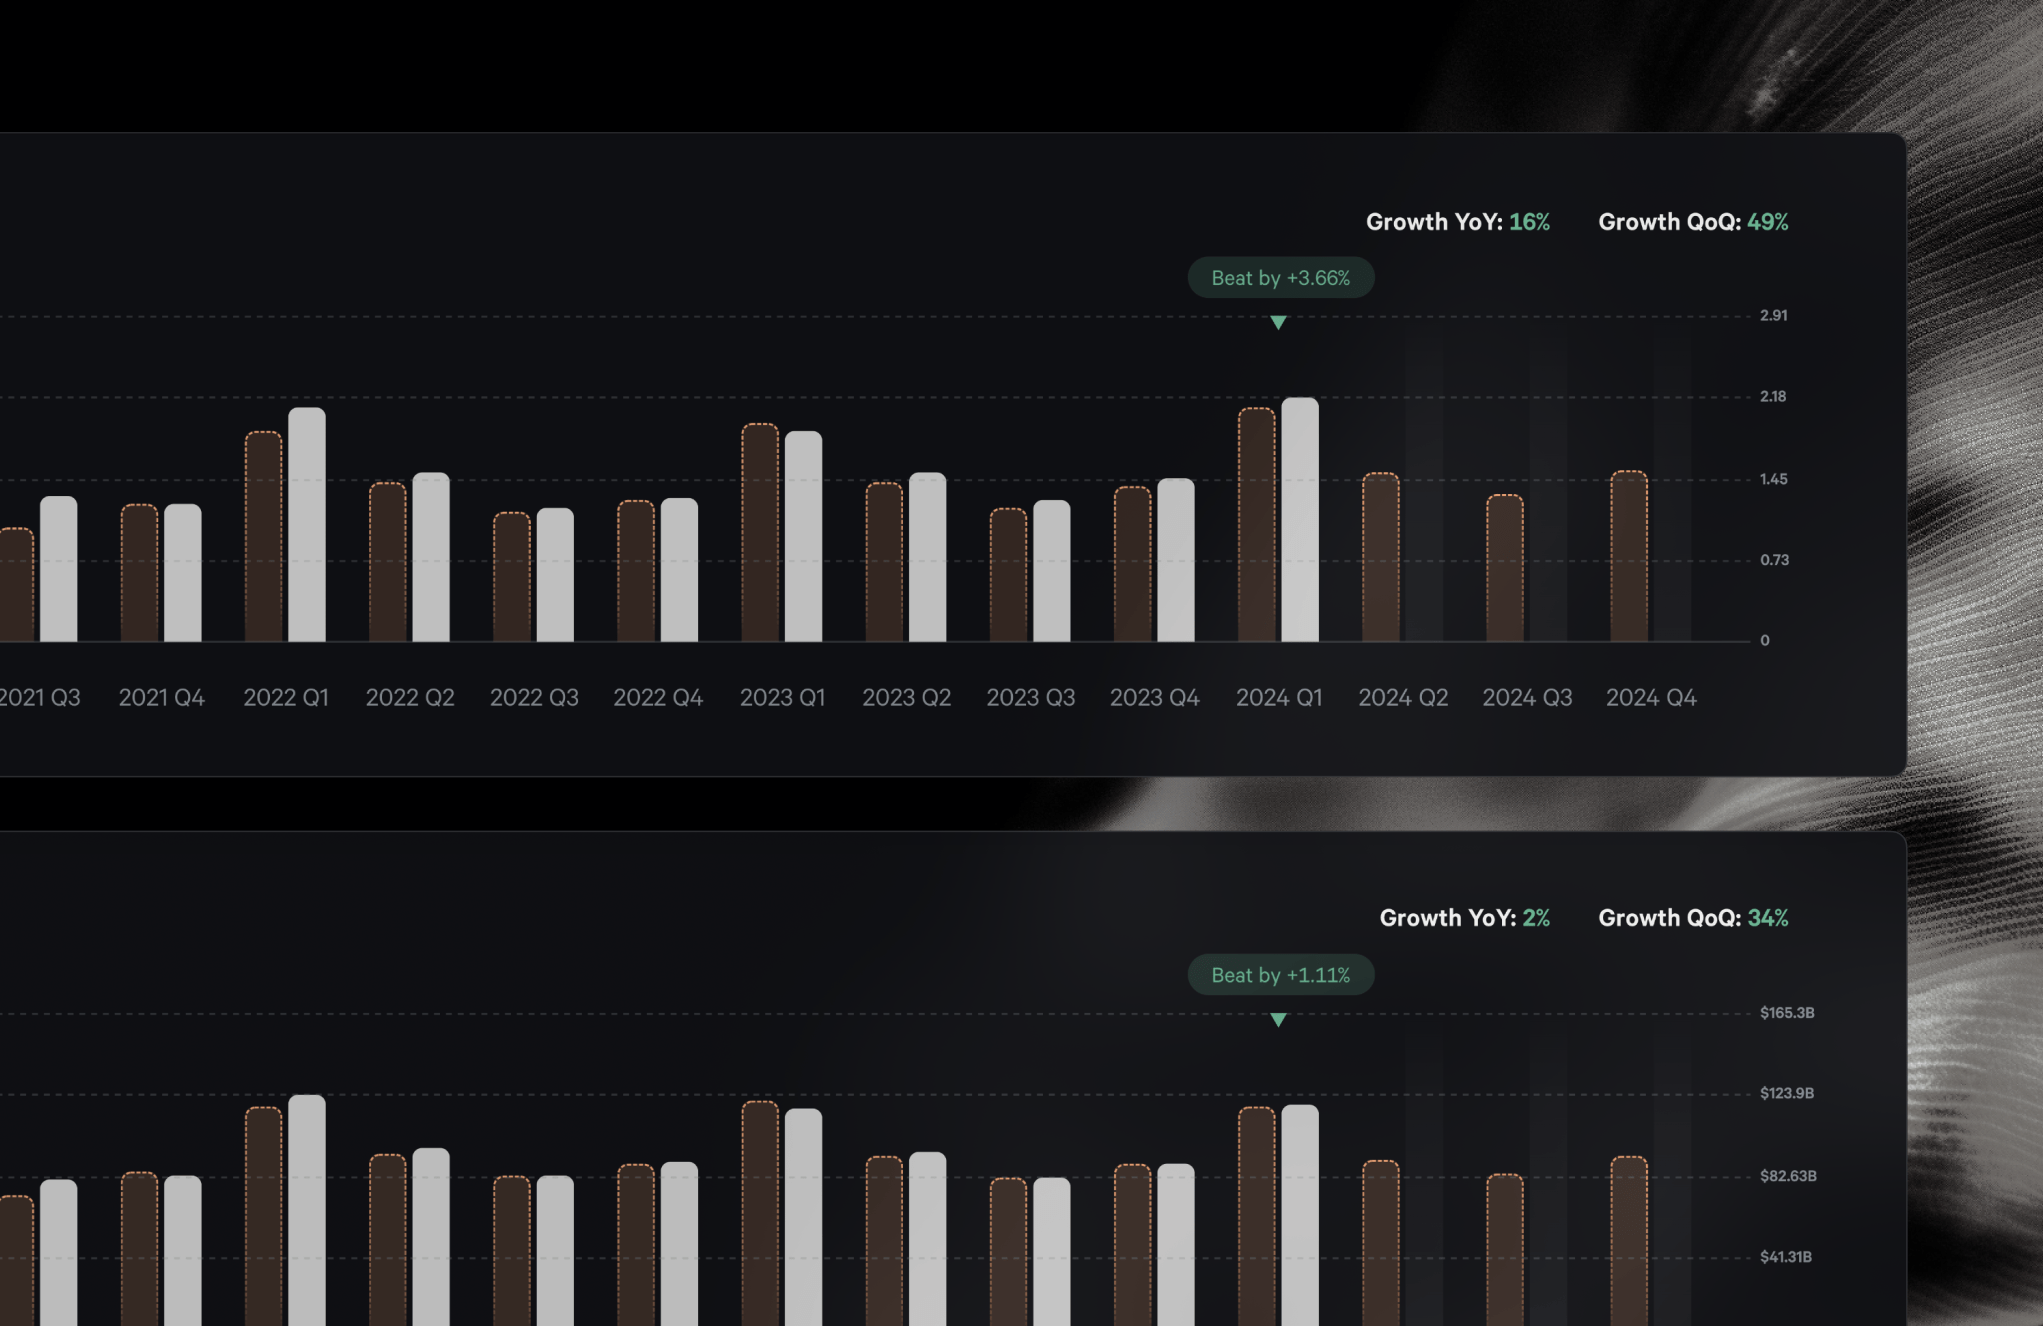
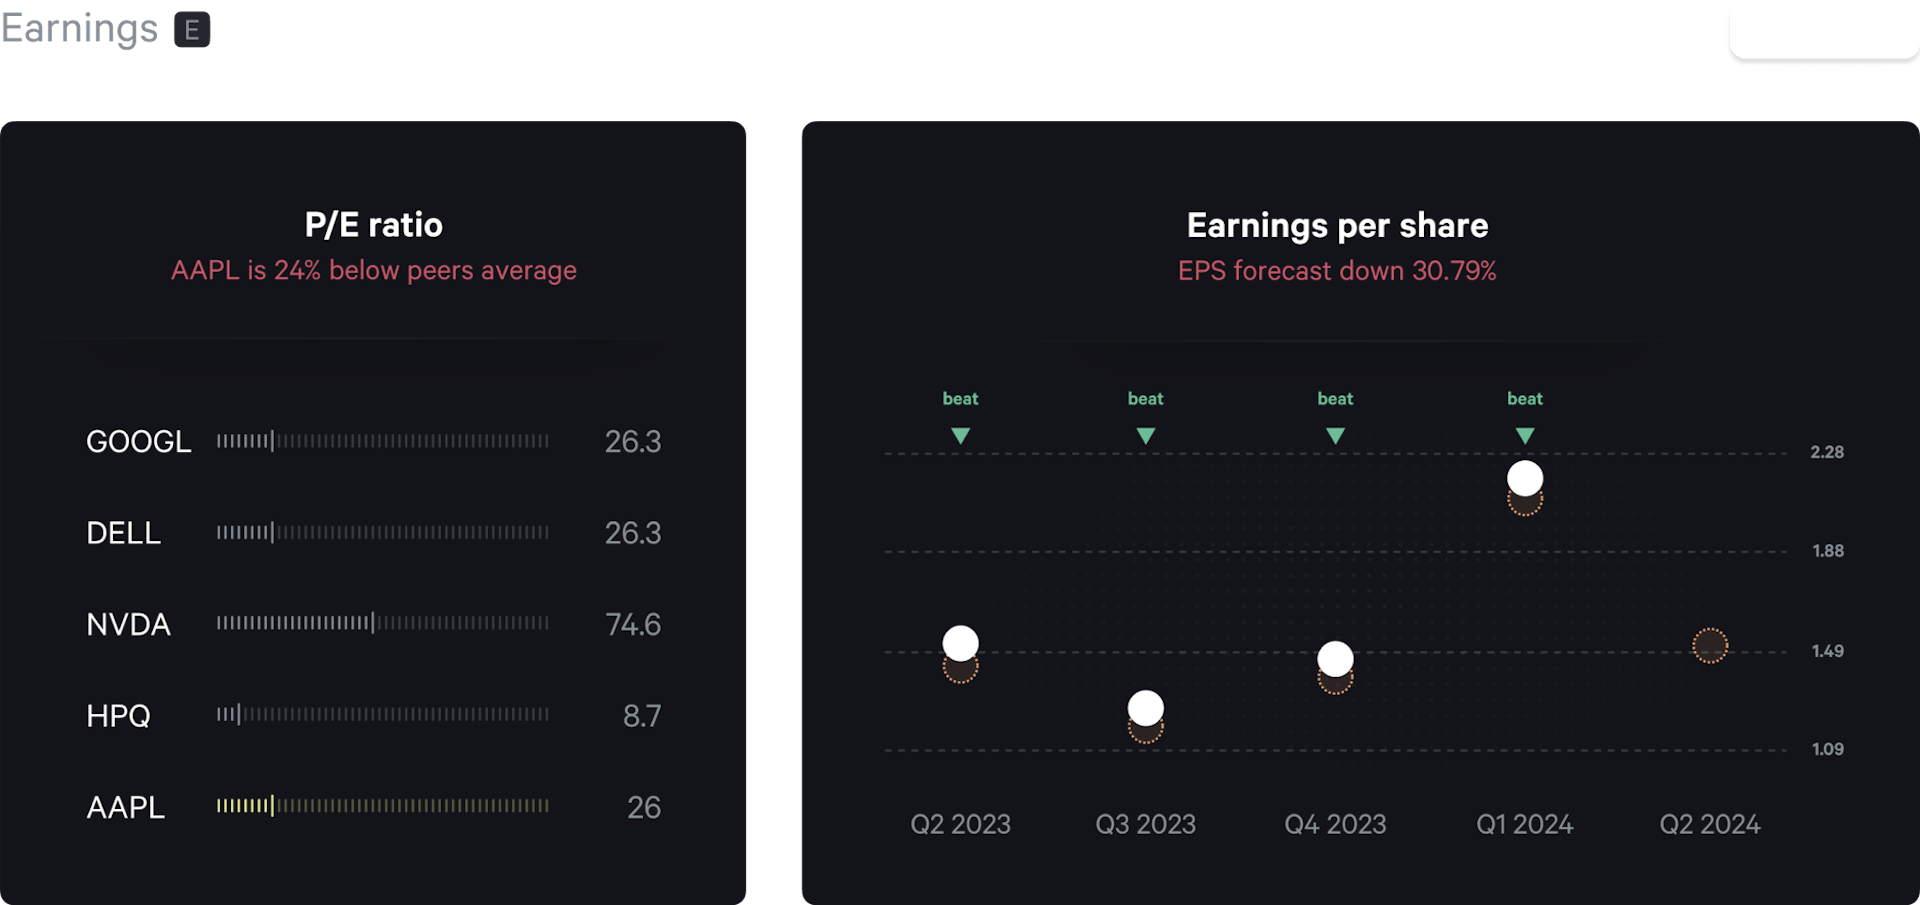
- EPS and revenue graphs: Visualize a company's financial health over time with our new graphs that display historical earnings per share and revenue data. These graphs are designed to help you identify trends at a glance.
- Updated visuals: We've refreshed the look with a new color scheme and a cleaner presentation of the EPS figures on our stock canvases to make the data easier to read and the interface more user-friendly.